OrderMap vs TradingView: Understand the Data Behind the Chart
Compare familiar charting with specialized options and futures analysis, including volume classification, profile scope and a practical evaluation routine.
By OrderMap Research4 min read
On this page
Moving from a familiar charting platform to a specialized market terminal should solve a specific research problem. If your current charts already answer that problem clearly, another subscription may simply add more things to watch. OrderMap and TradingView should be compared at the level of data definitions and daily tasks, not brand familiarity.
Public sources were checked on October 19, 2026. This article is published by OrderMap and reflects its commercial interest. It is not an independent usability study, an exhaustive feature inventory or a benchmark of either platform's data delivery.
Similar chart names can hide different inputs
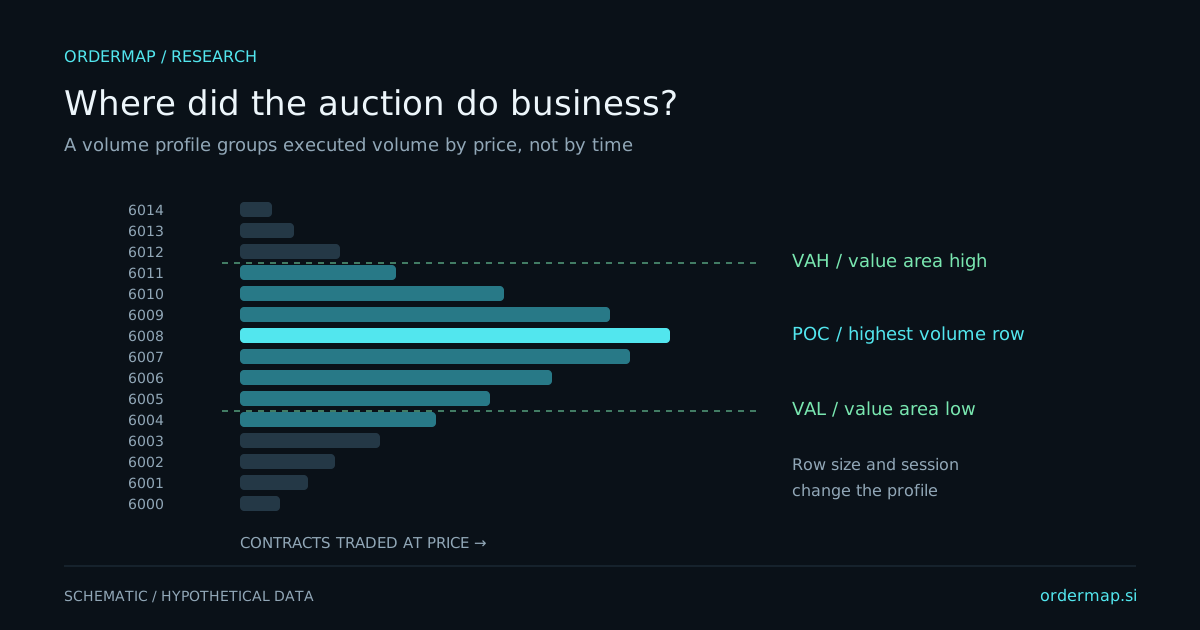
TradingView documents volume-profile concepts and a volume-footprint chart. Its documentation explains the use of intrabar information in historical calculations and the distinction between price-direction volume classification and execution-side interpretations.
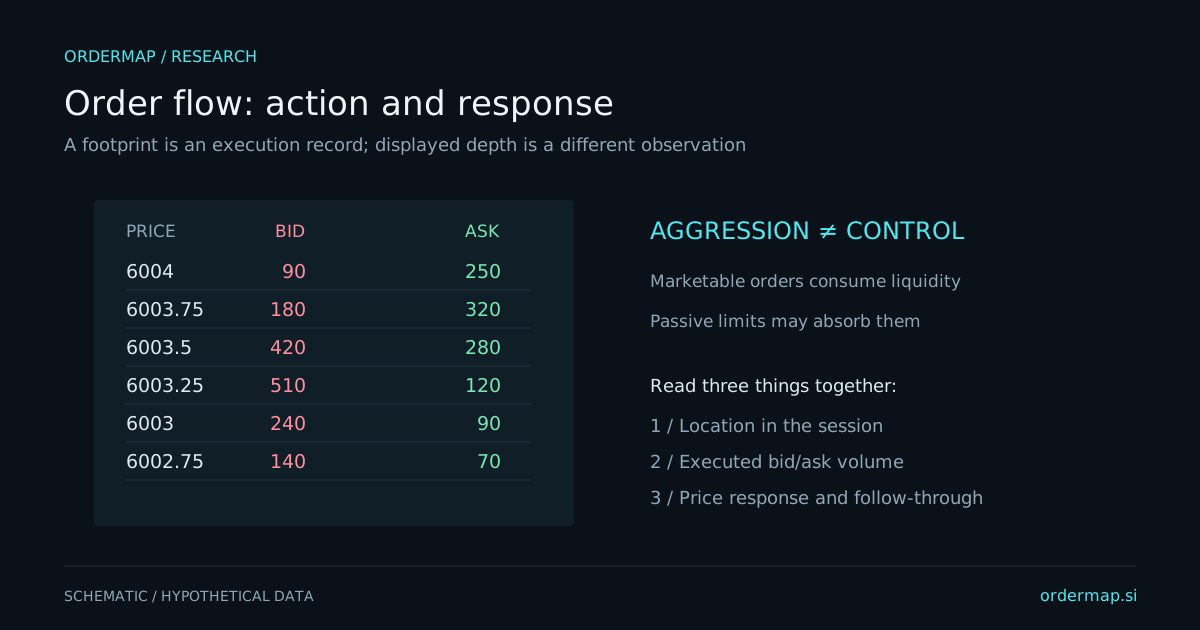
That methodological detail matters. A lower-timeframe price-direction estimate can be useful, but it should not automatically be described as the same observation as a provider-classified execution at the bid or ask. Before comparing a delta number, identify the calculation rather than assuming the label establishes equivalence.
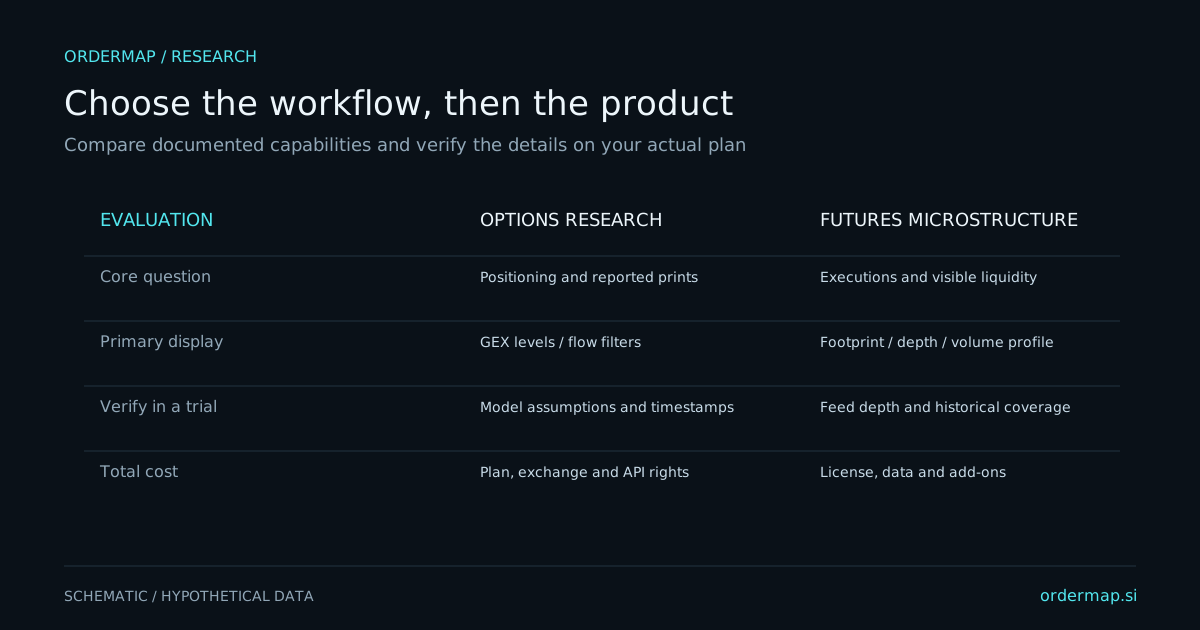
OrderMap's futures analysis uses captured executions with buy, sell and unknown-side quantities, alongside separate captured-depth views. Its options exposure and flow add another research domain. The useful evaluation is whether those inputs answer a question your current layout cannot answer confidently.
| Research question | What to verify | Buying implication |
|---|---|---|
| Where did volume concentrate? | Profile period, source and row construction | Either approach may serve the task when definitions fit |
| Was execution aggressive? | Side-classification method | Do not substitute price direction for observed execution context |
| What rested before price arrived? | Historical depth availability | A volume chart alone cannot answer this |
| What do options imply? | Chain scope, model and timestamp | A separate analytical layer is required |
| Can I reproduce the analysis? | Saved settings and historical inputs |