Top 5 Footprint Chart Products in 2026: A Practical Guide
Compare five footprint chart offerings by calculation method, row grouping, imbalance settings and research fit, with a reproducible trial checklist.
By OrderMap Research··4 min read
On this page
Footprint charts turn a bar into a price ladder of activity. They can show where volume concentrated, how a selected buying-versus-selling classification behaved and which rows meet an imbalance rule. Their usefulness depends on knowing how the cells were built.
This guide was checked on October 19, 2026. It shortlists five documented products, ordered by different workflow starting points rather than independently measured superiority. OrderMap publishes the article and sells related analytics. We have not benchmarked these products, audited their feeds or established comparative trading performance.
ATAS is a candidate when you want to evaluate multiple footprint presentations. The relevant question is which format helps you read the selected field with the least ambiguity, not how many display variations you can activate.
Compare five futures order flow platforms by heatmap, footprint, profile and review workflows, with a practical method for evaluating data fit.
·4 min read
Start with a quiet interval and a plain bid-by-ask layout. Add an imbalance highlight only after you can explain an uncolored row. If the colors become the explanation before the numbers do, reduce the visual complexity. A footprint should make an execution question easier to inspect rather than replace the question with a pattern name.
Sierra Chart's Numbers Bars provide a documented execution-study framework. It belongs on the shortlist for traders who want the calculation and configuration to be explicit parts of their research record.
Build one reference template and save the instrument, session, row grouping and field selection. Revisit an interval after a restart. The goal is reproducibility: can you explain why the same input produces the displayed interpretation? A visually sophisticated template that you cannot reconstruct is a weak research dependency.
NinjaTrader's Volumetric Bars documentation describes cell values, grouping and associated bar statistics. It is relevant when your process organizes execution observations around a defined bar type.
Evaluate the bar construction before the imbalance rule. Time bars, range bars and volume bars segment activity differently. A strong cell near a bar boundary may be split across two bars in another configuration. That difference can be legitimate without implying a data error. Record the bar definition with any saved setup example.
Quantower calls its footprint a Cluster chart and documents several views and data fields. It is a candidate when your routine moves between local bar detail and a broader distribution.
Test one selected event using total volume first, then signed or paired fields. Ask whether the second view adds information needed for the hypothesis. A large total-volume row can coexist with balanced aggression, and a high percentage imbalance can occur on a small absolute quantity. Neither display should be interpreted without its denominator.
TradingView's official footprint guide explains historical intrabar inputs and calculation behavior. It deserves consideration for readers already working in that chart environment, provided the method matches the intended research.
Do not assume a buying-versus-selling label is identical across products. A price-direction estimate and a quote-related execution classification are different methods. A sensible evaluation records the method explicitly and asks what inference it supports, instead of declaring every similarly named delta directly comparable.
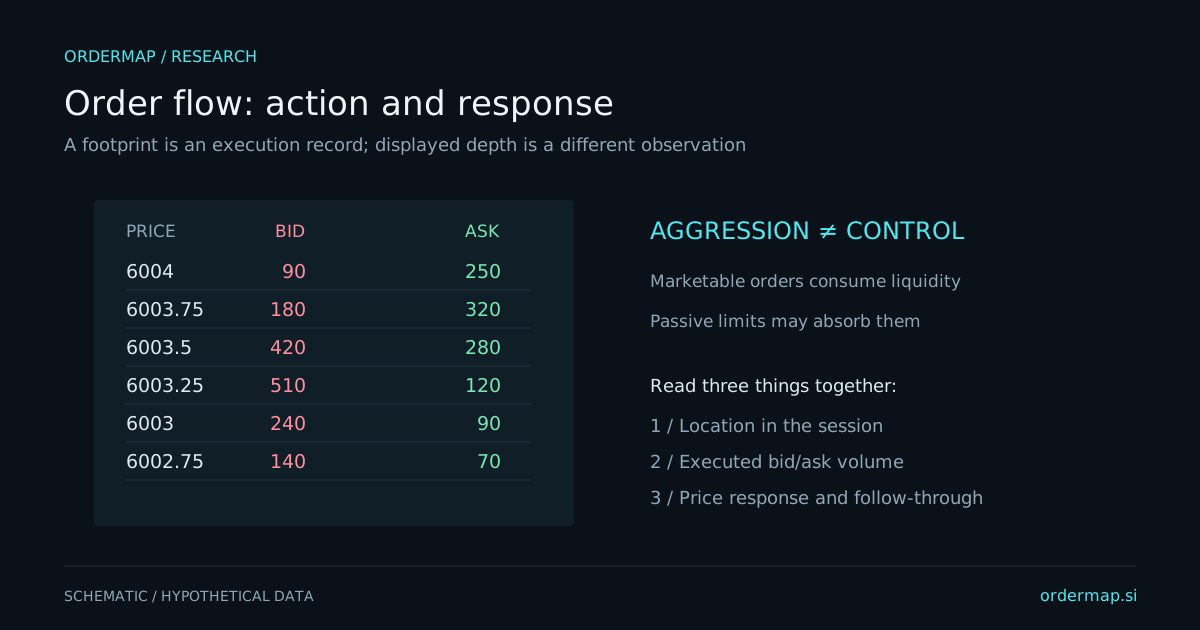
Schematic only. Footprint cells describe activity under a selected calculation and do not reveal participant identity.
Match the symbol, contract, session, bar construction and row size. Then inspect the classification method and the treatment of unknown observations. Confirm whether an imbalance is horizontal, diagonal, percentage-based or subject to a minimum-volume filter.
Consider an invented pair of rows containing 10 versus 1 contracts and 1,000 versus 100 contracts. Both produce the same ratio, but the absolute activity differs greatly. A threshold that ignores size can highlight quiet noise as prominently as meaningful participation. Evaluate the ratio and the quantity together.
Next compare aggression with price response. Positive delta describes the selected buying-minus-selling calculation. If price does not advance, that tension is worth investigating. It does not prove a specific passive participant, guarantee absorption or establish that the next move must reverse.
Choose an interval before reviewing its outcome. Write one question, such as whether buying activity near a defined boundary produced sustained acceptance above it. Save the settings and observation time. Inspect both the initial event and what happened afterward.
Repeat with at least one case where the anticipated response fails. The point is to evaluate whether the chart supports a clear observation and a revisable hypothesis. A gallery of attractive reversals selected after the fact cannot establish how useful a footprint will be during the next live session.
Confirm current package access, compatible data, historical depth requirements and device support directly. Footprints and liquidity heatmaps require different inputs; buying one does not automatically supply the other. Replay fidelity also depends on the available underlying records.
OrderMap offers configurable futures footprints beside session profiles, bubbles and captured depth, with separate options context in the terminal. Its source coverage and retention remain bounded, and it does not place orders. Review futures tools, plans and the OrderMap versus ATAS guide if that workflow fits your needs.
Choose the chart whose definitions you can explain, save and revisit. Readability matters, but the strongest buying criterion is knowing what the numbers actually represent.
Compare five documented liquidity heatmaps by captured-depth requirements, aggregation and review workflow, with a careful test for interpreting bands.