OrderMap vs ATAS: Footprints, Profiles and Research Fit
Evaluate footprint settings, session profiles, replay data and options context when choosing between ATAS and OrderMap for market analysis.
By OrderMap Research4 min read
On this page
A footprint platform should make the auction easier to investigate. It should help you understand which volume traded, how the chart groups it and what remains uncertain. The comparison between OrderMap and ATAS is therefore about your research process as much as the list of available indicators.
This article was checked against public documentation on October 19, 2026. It is published by OrderMap, which has a commercial interest in the comparison. We did not independently benchmark ATAS, subscribe to every configuration or compare simulated profits.
Begin with the footprint you actually use
ATAS documents footprint display settings including bid-by-ask, delta and volume-oriented views. Its profile documentation distinguishes volume distribution from time distribution. These are important foundations for traders who make footprints and auction profiles the center of their workspace.
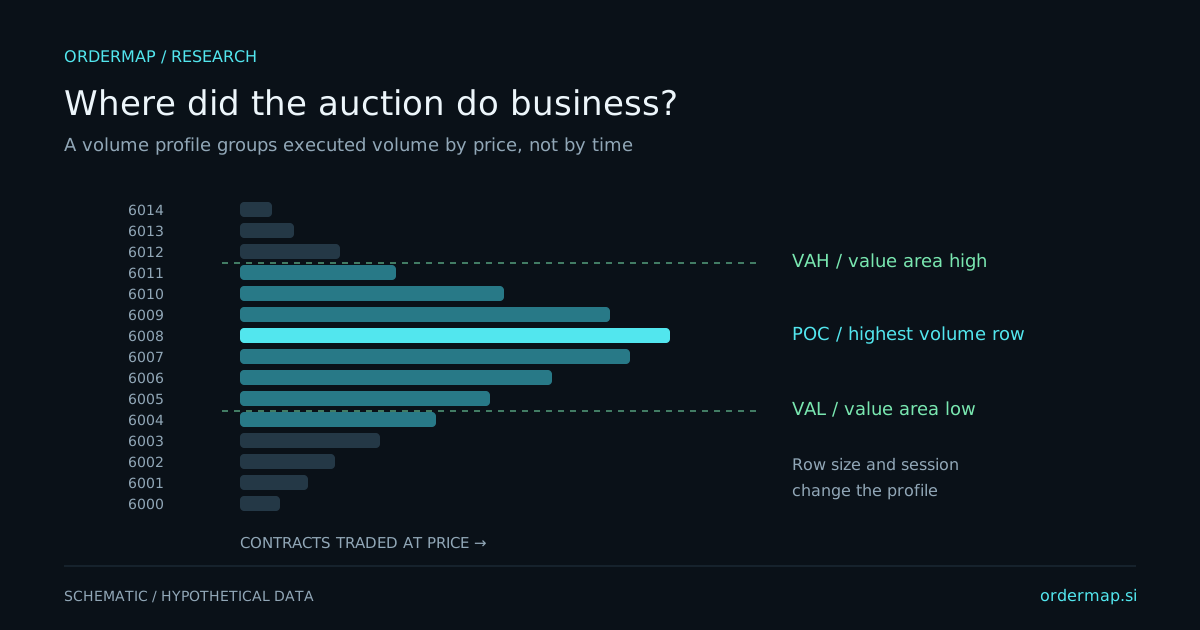
OrderMap's futures workspace offers footprint, bubble and candle modes with configurable row grouping, imbalance settings and an executed session profile. Options exposure and options-flow analysis live in the same terminal. The question is whether this connected context serves a recurring decision that your existing layout makes cumbersome.
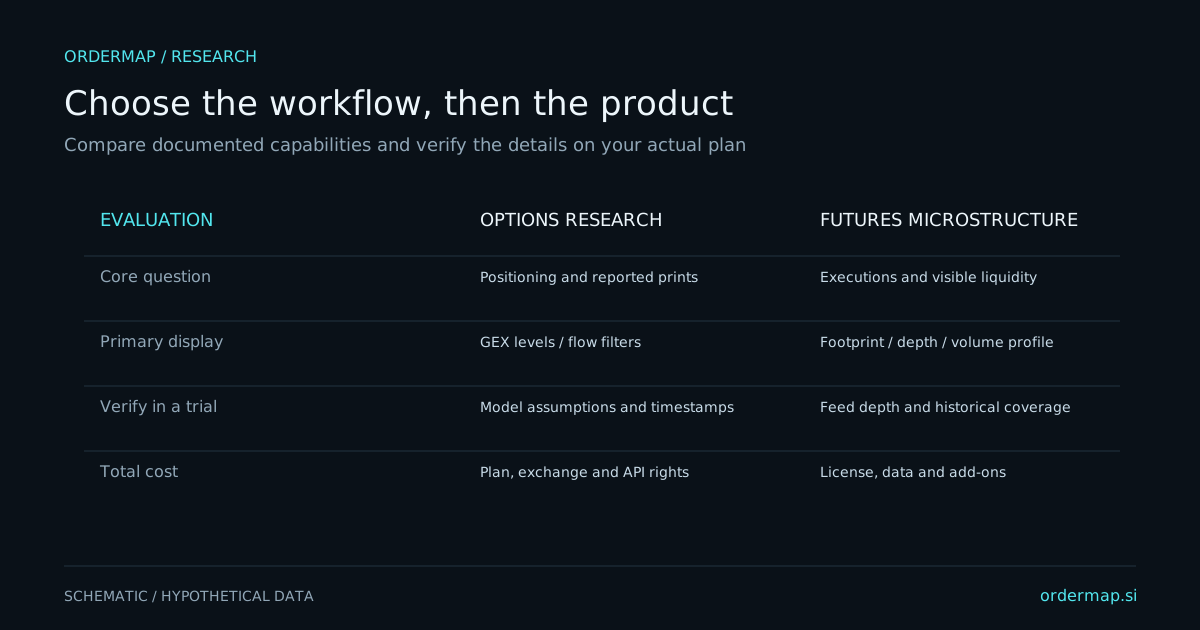
| Workflow | What to inspect in either platform | Why it matters |
|---|---|---|
| Footprint interpretation | Side classification, native ticks and grouping | Similar colors can represent different calculations |
| Session profile | Contract, trading hours and source coverage | A different window changes the distribution |
| Liquidity analysis | Real captured depth versus other heatmap types | Executed-volume color is not an order-book history |
| Review practice | Replay mode, dataset and historical scope | Synthetic depth cannot prove a historical depth event |
| Broader context | Options views and your actual coverage | Additional panels should answer a useful question |
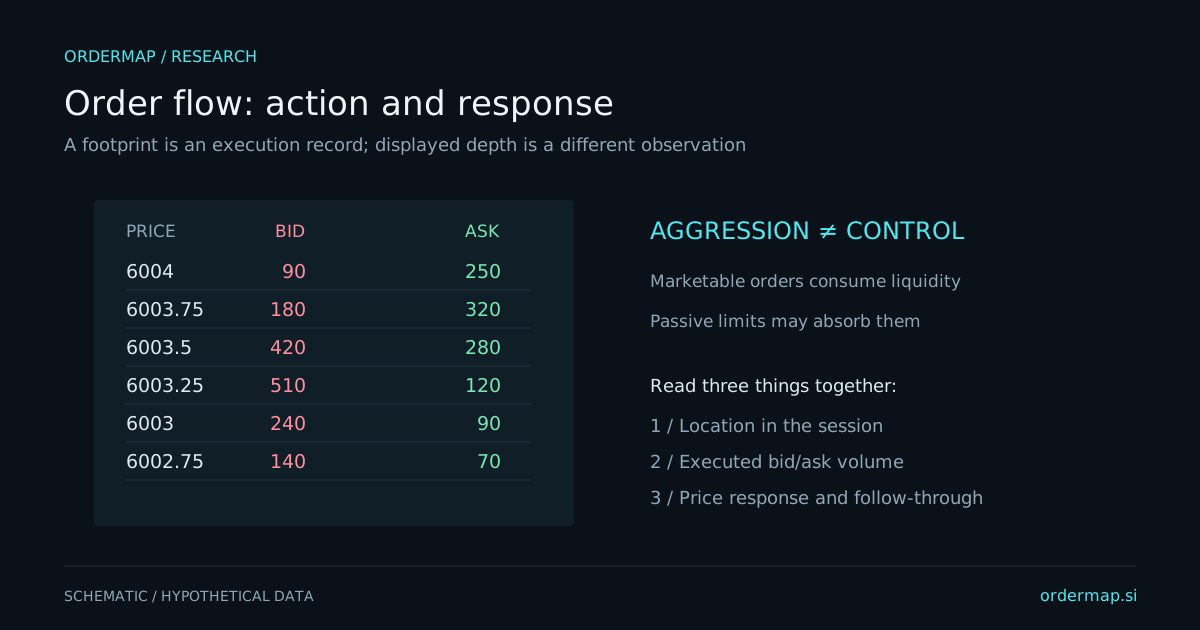
A diagonal imbalance is a setting, not an identity
Consider a hypothetical footprint row with substantially more ask-side volume than bid-side volume at the comparison row. That can satisfy an imbalance rule while price still fails to advance. The observation describes relative aggression under the selected formula; it does not identify the trader, the position's purpose or the direction of the next bar.