Volume Profile and VWAP: Use the Difference, Not Just Confluence
Compare a price histogram with a volume-weighted mean, work through a simple calculation, and interpret agreement without double-counting evidence.
By OrderMap Research4 min read
On this page
An average and a distribution answer different questions
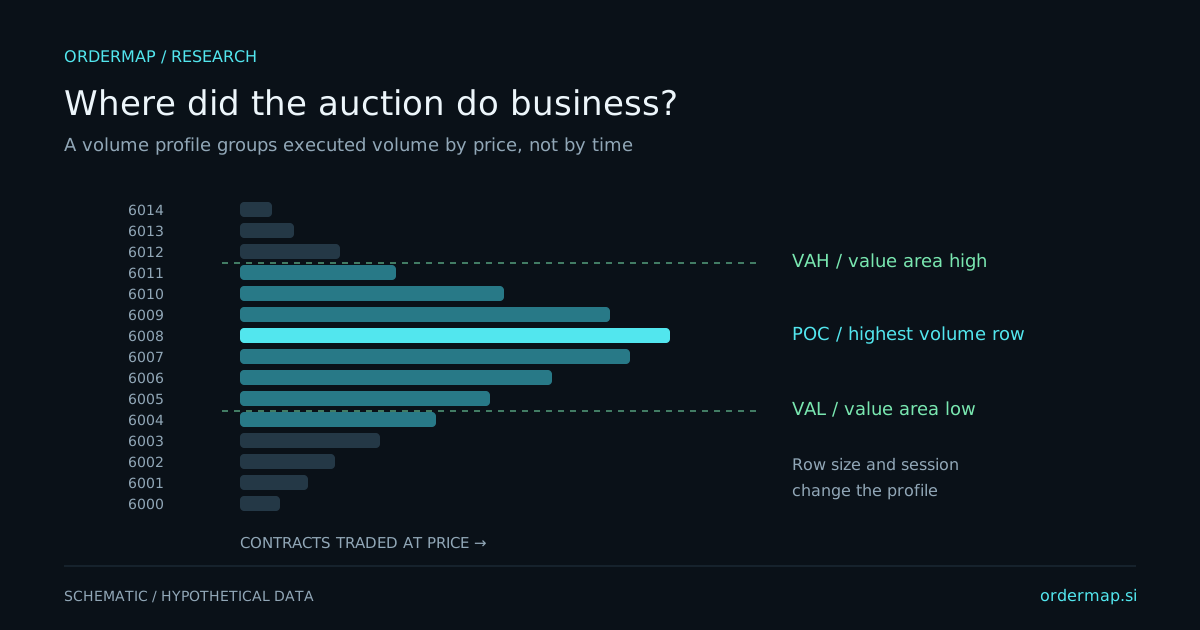
Volume-weighted average price, or VWAP, is the sum of price times volume divided by total volume over a chosen window. A volume profile is the full distribution of that volume across price rows. VWAP condenses the sample to a mean; the profile preserves its shape. The POC is the most active row, a mode rather than a mean.
This distinction is valuable when a market has more than one accepted region. VWAP can sit between them even if little traded at the average itself. A profile can show that separation directly. Conversely, VWAP can summarize a broad distribution more simply than a chart full of nodes.
Calculate a small example
Assume an invented market trades 100 contracts at 100, 200 at 102, and 100 at 106. Total volume is 400. The weighted sum is 41,000, so VWAP is 102.50. The most active price is 102, so the POC is 102. The market did not need to trade exactly at 102.50 for that average to exist.
| Price | Hypothetical volume | Price times volume |
|---|---|---|
| 100 | 100 | 10,000 |
| 102 | 200 | 20,400 |
| 106 | 100 | 10,600 |
| Total | 400 | 41,000 |
Now imagine two equally heavy clusters at 100 and 110 with almost no trading between them. VWAP sits near 105. Treating it as the market's most accepted price would be misleading. This is why the profile's shape matters even when an average is easy to plot.
CME's fixing-price overview gives an example of VWAP used over defined windows. The analytical comparison here uses the same weighted-mean principle, while the scenario choices are our own research framework.