Double-Distribution Profiles: When the Auction Finds New Value
Interpret two volume nodes and the valley between them, distinguish repricing from ordinary balance, and avoid predicting from profile shapes alone.
By OrderMap Research4 min read
On this page
Two bulges can describe a change of conversation
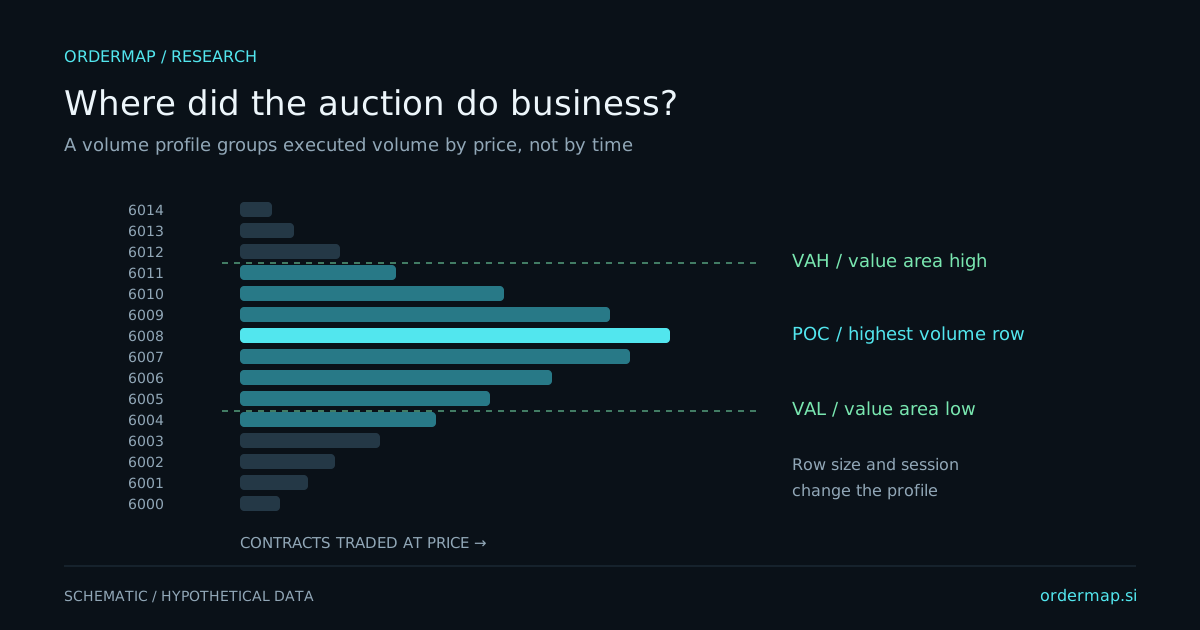
A double-distribution volume profile has two meaningful concentrations separated by a lower-volume region. One possible path is morning balance, a fast repricing, and later balance somewhere else. The profile records both areas, while a single session average can fall between them. The sequence matters as much as the final shape.
This pattern is descriptive. It does not establish that institutions accumulated below, distributed above, or intend to defend the valley tomorrow. Those stories require information the histogram does not contain. Start with what is observable: where volume traded, when it traded, and how the developing distribution changed.
Reconstruct the sequence with invented numbers
Imagine a hypothetical session that trades between 100 and 104 in the morning. Most volume clusters near 102. After an announcement, price quickly moves through 105 and 106, then spends the afternoon between 108 and 112 with a second node near 110. The completed profile has two bulges and a valley around 106.
At noon, however, the upper distribution may not yet exist. A researcher who uses the closing shape to justify an 11:00 a.m. decision has borrowed future information. Preserve snapshots or rebuild the profile chronologically so each judgment uses only the transactions available then.
| Stage | Information available | Question worth asking |
|---|---|---|
| Morning balance | A developed lower node | Is price still accepted in this area? |
| Fast departure | Range expansion through sparse prices | Does the departure persist? |
| Early upper trade | A small new sample | Is new activity accumulating or merely passing? |
| Later upper balance | A second developed node | Which region matters on the next retest? |