Footprint Charts: Bid, Ask, Delta, and Meaningful Imbalances
Read executed volume inside a candle, calculate diagonal imbalances, and distinguish aggressive trading from evidence that a price level will hold.
By OrderMap Research4 min read
On this page
A candle contains a sequence of transactions
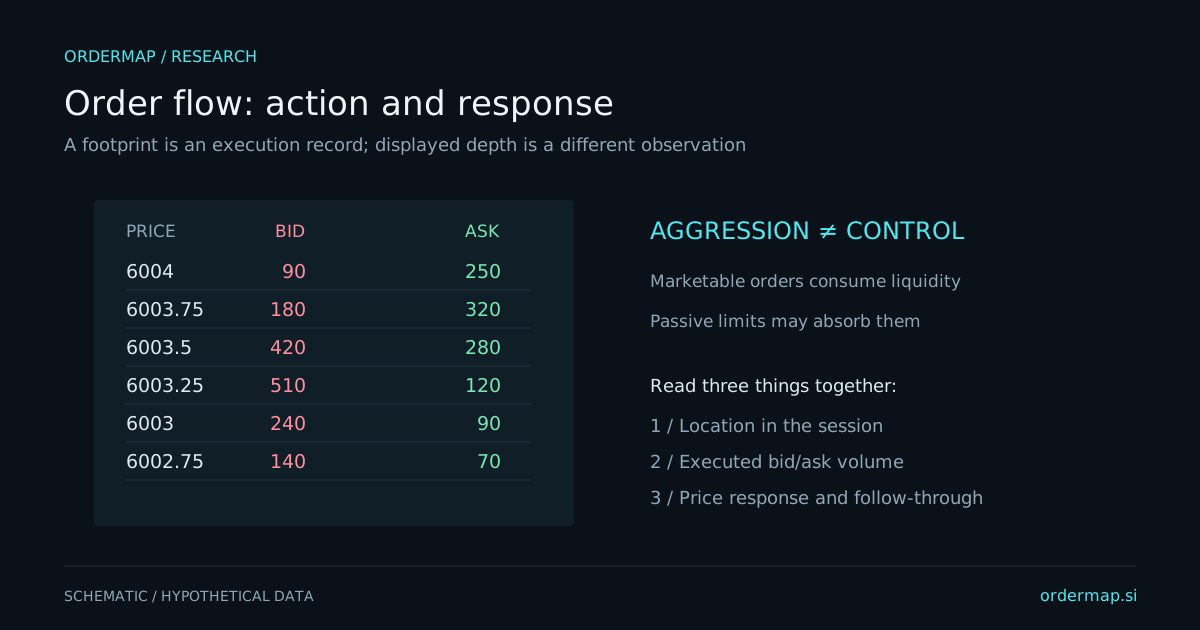
A footprint chart groups executed volume by price inside each bar. A common layout places bid-classified volume on the left and ask-classified volume on the right. It lets you ask where trading was concentrated, which side sought immediacy, and whether that activity produced price progress.
Both a buyer and a seller participate in every transaction. “Buying volume” normally means volume classified as buyer-initiated or executed at the offer, not transactions with buyers and no sellers. Classification can depend on exchange aggressor information or a vendor's inference. The distinction matters when comparing feeds.
Sierra Chart's Numbers Bars documentation describes several footprint displays and their inputs. The examples here use a simplified bid-versus-ask convention; check the exact definition in the tool you use.
Start with three measurements
Total volume adds the two sides. Delta subtracts bid volume from ask volume. An imbalance compares one side with another under a defined rule. These measurements are related but different. A bar can have high total volume, modest net delta, and several large local imbalances.
| Hypothetical price | Bid volume | Ask volume | Same-row delta |
|---|---|---|---|
| 100.50 | 40 | 160 | +120 |
| 100.25 | 80 | 120 | +40 |
| 100.00 | 100 | 60 | -40 |
The invented bar has 560 contracts of total volume and positive 120 delta. That does not establish whether price finished above its open. Aggressive buyers can meet substantial passive selling. The result of their activity is part of the interpretation, rather than something inferred from the sign alone.