Top 5 Futures Order Flow Products in 2026: Choose a Workflow
Compare five futures order flow platforms by heatmap, footprint, profile and review workflows, with a practical method for evaluating data fit.
By OrderMap Research··4 min read
On this page
Futures order flow is a family of research workflows. A heatmap user studies displayed liquidity through time. A footprint user studies executions inside bars. A profile user studies the distribution of activity. A trader may use all three, but the right platform depends on which question deserves the most attention.
This shortlist was checked against official sources on October 19, 2026. The ordering groups different documented workflows rather than awarding overall performance scores. We have not independently benchmarked these products or measured their profitability. OrderMap publishes the article and sells related analytics, so this is commercially interested editorial guidance.
Bookmap is a clear candidate when your first question concerns the relationship between displayed depth and subsequent executions. Its chart structure puts those observations in a shared visual context.
Evaluate a single repeated interaction, such as price approaching a visible offer region. Record whether the region remained, withdrew or traded. Do not label every withdrawal spoofing or infer participant identity. A heatmap describes the captured display; intent requires evidence the chart usually does not provide.
Compare five documented liquidity heatmaps by captured-depth requirements, aggregation and review workflow, with a careful test for interpreting bands.
ATAS belongs on the shortlist for traders who want to investigate several auction perspectives in a common platform. Its documented futures tools provide multiple starting points for that process.
Use the trial to simplify rather than maximize the layout. Begin with price and a profile, then add a footprint for a specific interaction. Add depth only when resting orders are part of the question. If each panel repeats the same execution data with a different color, more panels should not be counted as independent confirmation.
Sierra Chart is relevant when you value a research process built around carefully selected studies and settings. Its Numbers Bars documentation provides a concrete place to investigate execution fields.
During evaluation, document the calculation you require before adjusting the appearance. A saved template should capture assumptions about session, row grouping and classification. If changing those settings changes the interpretation, retain that sensitivity in your research notes rather than presenting one attractive configuration as inevitable.
NinjaTrader's documented Volumetric Bars make it a candidate for readers who want the bar itself to carry execution detail. The useful trial is a narrow event with known settings, not a full day of dense numbers.
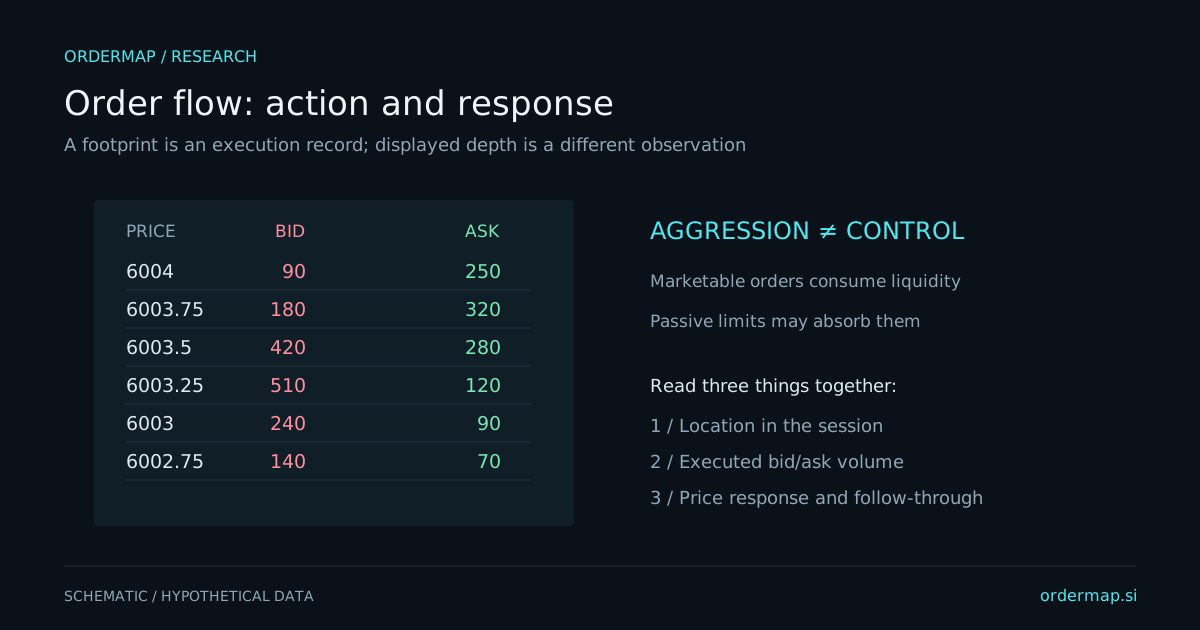
Observe a hypothetical bar with strong positive delta and little upward progress. The bar can describe aggressive buying that did not move price much; it does not automatically imply a reversal. Compare the following auction with your stated hypothesis and retain cases where the anticipated response never appeared.
Quantower's chart-and-analytics documentation describes cluster charts, profiles and historical time-and-sales. That combination is relevant when you want to move from a broad distribution to a local interaction.
Try selecting one profile region and examining the corresponding bar activity. Keep the data field consistent as you move between views. Trade count, volume and signed delta answer different questions. A region with many small trades can differ from a region with fewer large trades even when their total volume is similar.
Schematic only. The layers share coordinates but remain different observations with different data requirements.
Name the exact dated contract, exchange permissions and required fields. A footprint needs suitable executions; historical liquidity needs captured depth. A top-of-book source cannot establish the full depth ladder, and aggregated price depth cannot identify all order-level queue constituents.
Ask how the platform behaves during a disconnect. Does it mark missing observations, reload a suitable seed or silently carry stale information forward? A feature that handles normal conditions elegantly still needs a clear interpretation when the source becomes incomplete.
Match the time window during any side-by-side exercise. A five-minute footprint, a one-minute footprint and an adaptive grouped view may all summarize the same executions differently. Compare totals and definitions before judging visual resemblance.
Prepare one location and one hypothesis before the session. Observe what happens there with the minimum useful layout. Save the settings, time and data status. Review the same interval later without substituting the final chart for what you originally knew.
Include both a quiet and a busy session. Quiet conditions reveal whether thresholds highlight ordinary background activity. Busy conditions reveal whether grouping and readability remain useful. This is a practical fit assessment, not a statistically meaningful performance experiment.
Confirm current software packages, data charges, broker compatibility and archive requirements directly. If a platform also supports execution, that is a separate capability to assess; an analytical tool should not be assumed to replace a broker.
OrderMap connects futures footprint, profile and captured liquidity with options exposure and flow. It does not place orders, and retained coverage is bounded. Explore OrderMap's futures offering, platform and plans if that handoff fits your process.