Order-Flow Breakouts and Retests: Define Acceptance First
Create a testable breakout framework using prior structure, executed flow, and retest behavior, with clear invalidation and realistic fill assumptions.
Price crossing a prior high is a breakout event. Whether the market accepts higher prices requires subsequent evidence. A retest can help organize that evidence by showing what happens when the boundary is approached again. It is not mandatory: some successful departures never return, and some attractive retests fail immediately.
The framework below is a research template. It is not a validated trading system. Its purpose is to replace vague claims such as “strong buyers broke resistance” with observations that can be recorded before the outcome and evaluated after realistic costs.
Schematic only. The breakout and retest sequences discussed below use hypothetical prices and quantities.
A useful reference could be a prior session high, value boundary, opening range, or separation between volume nodes. Specify it before the breakout. If the line moves after every failed attempt, the study has no stable definition of success.
Imagine an invented balance region between 100 and 104, with 104 selected as the upper boundary. Record why that reference matters and the current session context. A departure during a quiet balanced market differs from a departure immediately after a major announcement. Separate those conditions in the review.
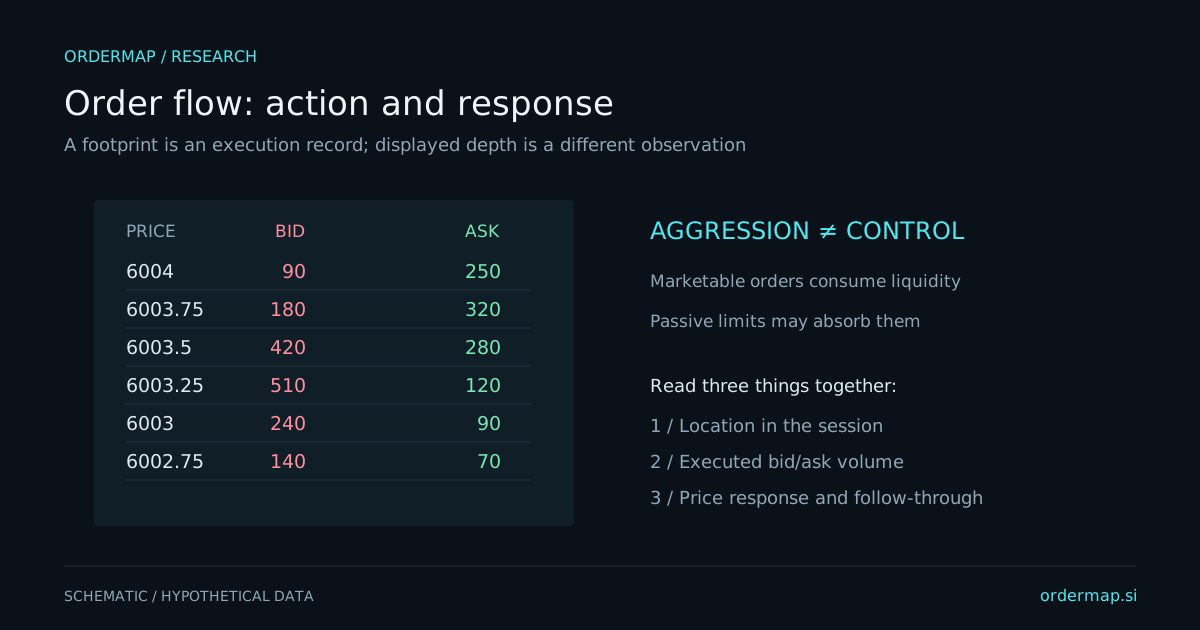
During a move above 104, ask whether aggressive buying produces progress and whether new trading builds outside the old range. Positive delta alone is insufficient. If substantial ask-side volume produces little advance, opposing supply may be meeting demand. If price advances on modest buying, available offers may be thin.
On the retest, ask whether selling produces sustained downside progress. A brief return to 104 followed by recovery is different from repeated trading below 104 and renewed volume inside the old balance. Avoid assigning meaning to one highlighted footprint cell without the sequence around it.
Sierra Chart's Numbers Bars documentation explains how bid, ask, and delta displays are constructed. Those measurements support observation, while the acceptance rules must be defined and tested separately by the researcher.
In the invented example, a continuation hypothesis might require price to hold above the reference region and develop volume near 105. A failure hypothesis might require a sustained return below 104 and inability to reclaim it. The exact price tolerance and duration depend on volatility and the chosen timeframe.
If the required retest never occurs, record no setup. If the market gaps through the reference, do not pretend an ideal entry at 104 was available. If the market returns far enough to invalidate the original premise, do not relabel the same idea a longer-term position without a separate plan.
This discipline is particularly important when several indicators agree. A gamma reference, volume boundary, and chart high near the same price can create a persuasive story. Agreement establishes a location worth watching; it does not remove the need to define failure.
A historical touch does not guarantee a limit fill, and a stop does not guarantee a particular exit price. Marketable orders may pay spread and impact. Limit orders can remain unfilled during the best continuations and fill disproportionately during failures. That selection effect belongs in the evaluation.
CME's futures-order guide describes the different behavior of order types. For any research strategy, model the instrument and venue you actually use rather than assuming a generic chart entry is executable.
In a hypothetical study, compare a conservative marketable-entry assumption with a limit-entry assumption that includes missed fills. Add fees and observed slippage. A breakout rule that works only with perfect limit fills at every retest has not demonstrated a usable advantage.
Start with one reference type and one instrument. Save the initial level, breakout time, flow observation, acceptance rule, retest result, and invalidation. Include all qualifying attempts over a fixed period, not just the cleanest examples. Compare first attempts with repeated attempts separately.
Review whether order-flow detail improves a price-only baseline. Did it reduce false breaks, delay entries too much, or encourage chasing? Keep a holdout period that was not used to choose thresholds. A useful framework should survive a reasonable range of settings rather than one precise historical fit.
Combine this with volume-profile basics and position sizing. OrderMap provides read-only analytics; verify available data and entitlements, and keep execution and risk controls with the separate services through which you trade.
In an invented ten-attempt sample, suppose four breakouts continue immediately without returning to the proposed limit entry. Three retest and continue, while three retest and fail. A chart review that awards a perfect entry to all ten can make the strategy appear much stronger than an executable retest rule.
Under the stated limit-entry approach, the four immediate continuations are missed opportunities. They should remain in the record because they explain the strategy's participation rate. The six retests form a different subset, potentially with different success and adverse-selection characteristics.
Compare that subset with a separately defined marketable-entry rule. Do not combine the best entry from each after the outcome. A fair comparison holds each rule intact, includes its costs and misses, and evaluates whether the added order-flow conditions improve the result enough to justify the complexity.