Options Volume vs Open Interest: Activity Is Not Inventory
Understand how opening and closing trades affect open interest, why intraday volume cannot prove new positions, and how to reconcile the next clearing update.
Volume counts contracts traded during an interval. Open interest counts contracts that remain outstanding after the relevant clearing process. An active contract can trade many times without a comparable increase in open interest. Large turnover does not automatically mean a large new position has appeared.
The OIC general-information FAQ explains that updated open interest follows end-of-day clearing and the pairing of opening and closing positions. A screen showing fresh intraday prices alongside open interest may therefore combine different observation times. The interface should make that distinction clear.
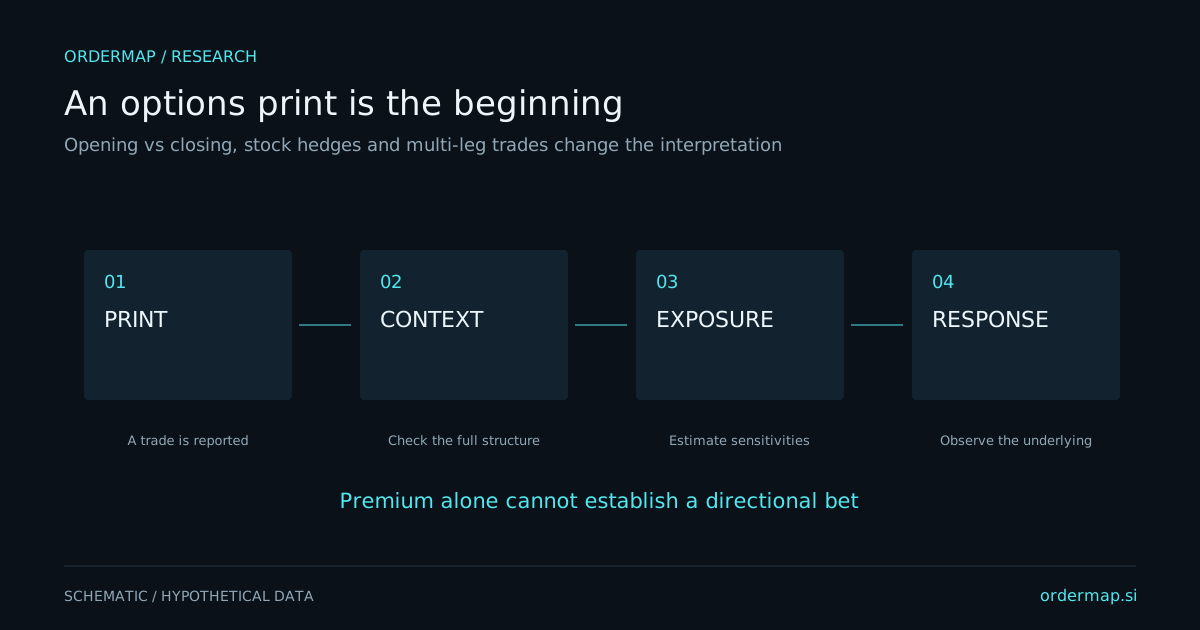
Schematic only. No current open interest, clearing result, or participant inventory is represented.
When both sides open, an outstanding contract is created. When both close, one is removed. When one side opens and the other closes, ownership transfers without changing the outstanding count. All three cases contribute to volume.
Hypothetical 100-contract transaction
Buyer status
Seller status
Open-interest effect
New long meets new short
Opening
Opening
Increase by 100
Existing short meets existing long
Closing
Closing
Decrease by 100
New long replaces existing long
Opening
Closing
No change
Existing short replaced by new short
Closing
Opening
No change
This is a simplified transaction-level explanation. The published clearing result also reflects exercises, assignments, expirations, and other relevant processing. The OIC article on why open interest matters distinguishes accumulated outstanding contracts from session activity.
Suppose yesterday's open interest was 500 contracts and today's volume reaches 5,000. That is notable activity relative to the starting count. It still does not prove that 4,500 new contracts are being opened, because contracts can turn over repeatedly and opening and closing transactions can offset during the day.
An invented example makes the problem clear. Five hundred outstanding contracts could change hands ten times, producing 5,000 volume while leaving open interest unchanged. Alternatively, most of the volume could create new contracts. Intraday gross volume alone cannot distinguish those paths.
Even a large next-day increase does not identify which specific print opened the new positions unless additional evidence supports the link. If several large transactions occurred at the same strike, attributing the entire increase to one alert is an unsupported leap.
Save the open-interest as-of date, not just the time your dashboard fetched it. Distinguish prior clearing-day data from current intraday volume. If a provider revises a series later, retain the original observation when evaluating what was knowable at the decision time.
Contract identity also matters. Strike, expiration, call or put, underlying, and any adjustment details define the series. Aggregating nearby strikes or combining expirations can be useful for context, but the comparison must be labeled. A ratio computed from one series' volume and another series' open interest is simply wrong.
Around expiration, changes can reflect contracts leaving the outstanding universe rather than traders changing directional conviction. Around corporate actions, adjusted contracts may require careful deliverable mapping. Preserve the actual contract identifiers instead of relying only on a shortened display label.
Every outstanding option has a long and a short holder. A large call concentration does not tell you whether dealers are long or short those calls. It also does not tell you whether the customer side is hedged with stock, futures, or other options. That is why GEX models need an explicit inventory convention.
Similarly, a fall in call open interest could reflect long holders selling, short holders buying back, or several offsetting processes. A directional interpretation requires more context than the outstanding count. Avoid converting every increase into bullish accumulation and every decrease into bearish distribution.
Create a research row for each unusual contract: prior open interest, session volume, notable print times, premium, quote context, and the next published open-interest value. Calculate the net change, but keep it separate from the gross activity. Note any expiration or adjustment event.
Then classify the evidence conservatively: increased outstanding interest, decreased outstanding interest, little net change, or unavailable update. Add possible explanations in a separate field. This prevents a tentative intraday inference from quietly becoming a claimed fact after publication.
For a twenty-session exercise, compare how often large volume-to-open-interest ratios lead to meaningful next-day changes. Also track whether the underlying's later behavior differs from a simple high-volume baseline. Keep the results specific to the instrument and sample rather than announcing a universal rule.
Suppose an invented series begins with 2,000 open contracts, trades 10,000 during the session, and next reports 2,500 open contracts. The net increase is 500. It is incorrect to call the remaining 9,500 contracts definitively closing volume. Some could be transfers, repeated turnover, or offsetting opening and closing activity.
The defensible statement is narrower: substantial turnover occurred and the outstanding count increased by 500 after clearing. If one large print was 3,000 contracts, the aggregate change does not prove that print opened 500 and closed 2,500. The public totals do not provide that decomposition.
For your journal, store the raw starting count, total volume, ending count, and any known processing events. Keep proposed explanations in a separate field. This preserves an audit trail and prevents a useful activity alert from becoming an exact position story that the data never established.